

Every fab shop generates useful data. Spools get cut, welded, inspected, and shipped. Crews log hours. Material gets consumed or scrapped. The problem is that most of that information disappears when the project closes out. The next estimate starts from the same unit rates the company has used for years, and the next schedule is built on the same optimistic assumptions.
MEP contractors that break this cycle do something simple in principle: they capture fabrication production data on every job, compare it against what was estimated, and feed the difference back into the next bid. Over time, their numbers get sharper and their schedules get harder to break.
Fabrication production data is the record of what actually happened in the shop on a given project: labor hours per assembly, cycle time by station, throughput, rework, material usage, and delivery performance. When it is captured consistently and tied to the original estimate, it becomes a company’s most reliable source for construction estimating and scheduling.
Why Estimates and Schedules Keep Drifting
Most estimating departments rely on a mix of published labor units, personal experience, and past bids. Few can say with confidence how long a 4-inch carbon steel spool with six welds actually took their own shop to build last quarter.
That gap shows up in research. In the Dodge Data & Analytics SmartMarket Brief on digital fabrication for mechanical contractors, 91% of respondents said they prepare an estimate specifically for fabrication, yet no single estimating method dominates. Some apply a percentage of labor or material from the standard estimate, others build a detailed fabrication estimate, and many smaller firms use neither approach.
The same report shows a clear divide in how companies use their shop data. Large contractors use fabrication data for scheduling at a rate of 60%, compared with 39% of small and mid-size firms. For time tracking, the split is 53% versus 37%. Large firms also ranked forecasting and scheduling fabrication work as their single most pressing improvement need.
The stakes are high. McKinsey’s analysis of construction productivity cites a study of 2,700 projects in which 44% ended at a loss. When margins are that thin, a bid built on stale unit rates can turn a profitable job into a write-down.
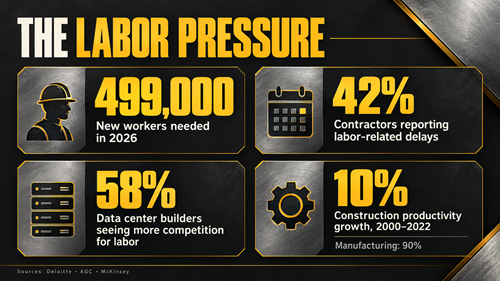
Key Numbers MEP Leaders Should Know in 2026
- 499,000: New construction workers the U.S. industry needs in 2026, according to Deloitte’s 2026 Engineering and Construction Industry Outlook. Deloitte also estimates unfilled positions could cost nearly $124 billion in construction output.
- 42%: Share of contractors reporting that workforce shortages delayed projects in the past year, per the AGC 2026 Workforce Survey released September 2026.
- 58%: Among firms that built data centers in the past year, the share that say those projects increased competition for skilled workers (AGC, 2026).
- 10%: Total construction productivity growth from 2000 to 2022, compared with 90% for manufacturing (McKinsey).
With labor this tight, the hours in your estimate need to reflect how your shop actually performs. Guessing high loses bids. Guessing low loses money.
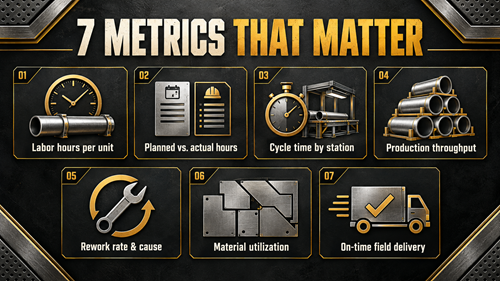
What Fabrication Analytics Should MEP Project Managers Track?
You don’t need hundreds of metrics. You need a short list, captured the same way on every project, so the numbers can be compared across jobs.
- Labor hours per unit of work. Track hours per spool, per weld, per joint, per foot of pipe, or per pound of sheet metal. Pick units that match how you estimate.
- Planned vs. actual hours by package. This is the variance that tells estimators where their assumptions were wrong, and by how much.
- Cycle time by station. How long work sits at cutting, fit-up, welding, QC, and shipping. Long queues point to scheduling bottlenecks, not just slow labor.
- Spools, assemblies, or pounds completed per day or week. This is the number schedulers need to set realistic fabrication durations.
- Rework rate and cause. Separate design changes from shop errors and field damage. Each one points to a different fix.
- Material utilization and scrap. Useful for tightening material allowances in future bids.
- On-time delivery to the field. A direct measure of whether shop schedules are supporting installation.
For a deeper look at applying these on mission-critical work, see 5 Metrics Every Fab Shop Needs to Track on Data Center Projects.
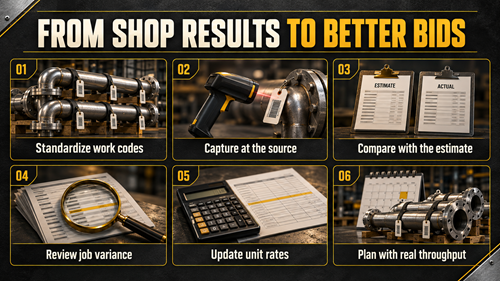
How to Turn Fabrication Data Into Better Bids and Schedules
Collecting data is the easy part. The value comes from building a routine that moves it from the shop floor back to the estimating and planning teams.
- Standardize how work is categorized. Use consistent assembly types, materials, sizes, and work codes across every project. If one job calls it a “hanger assembly” and another calls it a “support,” the data won’t compare.
- Capture production data at the source. Barcode or QR scans at each station record start, stop, and completion times without relying on end-of-week timesheets. Manual entry after the fact is where accuracy falls apart.
- Tie shop data to the original estimate. Every package should carry its estimated hours and material so variance can be calculated automatically as work progresses.
- Review variance at closeout, not just at the end of the year. Hold a short post-project review with the estimator, PM, and shop lead. Ask where the job ran over or under and why. One contractor quoted in the Dodge report described discovering they had installed 50% more fittings than estimated, which only surfaced because they tracked actuals against the estimate.
- Update unit rates and duration assumptions. Build a historical database of actual rates by assembly type and material. Replace generic labor units with your own shop’s numbers once you have enough data points.
- Feed throughput into schedule planning. Use real throughput figures to set fabrication durations, sequence releases, and flag when a project’s demand will exceed shop capacity.
Repeat this on every job and the historical database grows on its own. Within a few projects, estimators stop relying on memory and start pricing work from evidence.
Why This Matters More on Data Center and Industrial Work
Data center construction is one of the few segments still growing quickly, and Deloitte projects U.S. data center power demand could grow more than fivefold by 2035. These projects bring compressed schedules, heavy prefabrication, and repetitive assemblies such as racks, skids, and piping modules.
Repetition is where historical fabrication data pays off most. If your shop has built 200 similar rack assemblies, you should know exactly what the 201st will cost and how many days the next 50 will take. Contractors who can prove that on a bid have a real advantage with owners and GCs who can’t afford schedule risk.
How MSUITE Connects Shop Data to Future Planning
MSUITE FAB captures production data as work happens. Spools and assemblies are tracked from release to shipment by station, status, and crew. Labor hours log against production targets in real time, and every assembly carries a scannable record from the shop to the field.
Because work orders and bills of material come directly from the BIM model, estimated quantities and actual production live in the same system. That makes planned-versus-actual reporting a byproduct of normal shop activity rather than a separate spreadsheet exercise. Project managers see live progress, and estimators get a growing record of how the shop actually performs.
Contractors using MSUITE report 25 to 30% gains in shop productivity after connecting BIM, fabrication, and field workflows. Read more about what real-time production visibility looks like in a fab shop.
Frequently Asked Questions
How do MEP contractors use fabrication production data to improve future project planning?
They record actual labor hours, throughput, and cycle times for each assembly type during fabrication, compare those numbers to the original estimate, and use the variance to update unit rates and schedule durations for future bids. Over several projects, this builds a historical database based on the contractor’s own shop performance instead of generic labor units.
What fabrication analytics should MEP project managers track?
The most useful metrics are labor hours per unit, planned versus actual hours by package, cycle time by station, throughput per day or week, rework rate by cause, material utilization and scrap, and on-time delivery to the field. The key is to capture them consistently on every project so results can be compared.
How much historical data do you need before adjusting estimates?
There is no fixed threshold, but most contractors start seeing reliable patterns after three to five projects with similar assembly types. Repetitive work like hangers, racks, and piping modules builds useful averages fastest. Start by adjusting rates for your highest-volume assemblies first.
Can fab shop management software replace estimating software?
No. Fab shop management software captures what happened in production, while estimating software prices future work. The value comes from connecting the two so real production data informs the unit rates your estimators use.
Start Bidding From Your Own Numbers
Every project your shop completes is a chance to make the next estimate more accurate. The contractors winning work in a tight labor market are the ones who can price and schedule based on proof.
Book a demo with MSUITE to see how MEP and industrial contractors capture fabrication data automatically and use it to plan future projects with confidence.