
Ask ten shop managers how productive their fab shop was last month and you’ll get ten different answers. One counts spools shipped. Another counts hours billed. A third just knows it “felt busy.”
That’s the problem. Without a shared set of numbers, you can’t find the bottleneck, you can’t prove the shop is improving and you can’t defend your labor budget when the next job is bid. And the industry isn’t giving anyone extra slack: McKinsey found that construction labor productivity has grown only about 1% a year over two decades, against 3.6% in manufacturing. A fab shop is supposed to close that gap. KPIs show whether it is.
Here are the seven KPIs every MEP fabrication shop should track, how to calculate each one and what to do with the results.
Definition: What is a fabrication productivity KPI? A fabrication productivity KPI (key performance indicator) is a measurable value that shows how efficiently an MEP fab shop turns labor, material and time into finished, field-ready assemblies. Good fab shop KPIs are tracked by spool, package and project. They compare actual results to the estimate or schedule. And they update often enough (daily or weekly) for a manager to act on them before a job goes off track.
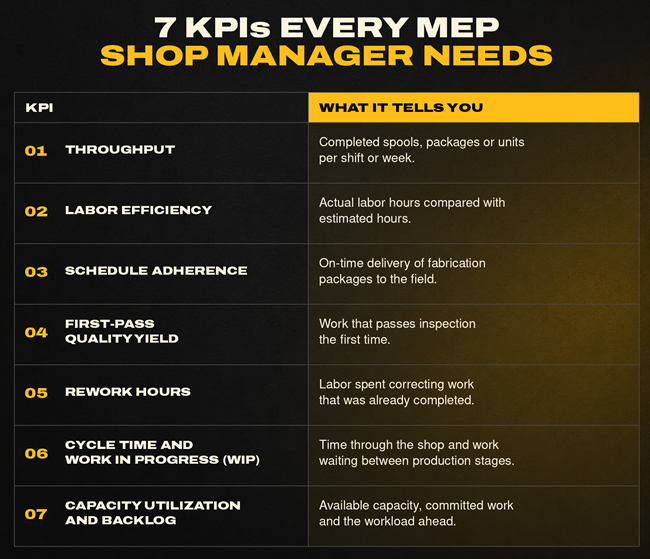
What KPIs should MEP fabrication shop managers track to measure productivity?
1. Throughput
What it measures: How much finished work leaves the shop in a given period. How to calculate: Units completed ÷ time period. Pipe shops often use factored diameter inches (FDI) or welds per day. Sheet metal shops use pounds or fittings per day. Plumbing and multi-trade shops use assemblies per week.
Throughput is the headline number, but it’s only useful when it’s measured the same way every week. Some contractors post dramatic numbers once they track it. In MCAA’s Winter 2026 Smart Solutions issue, Waldinger Corporation reported 300–345 FDI a day from robotic spool welding. You can’t plan around a number like that unless you’re measuring it consistently.
2. Labor efficiency (actual vs. estimated hours)
What it measures: Whether the shop builds work in the hours the estimate allowed. How to calculate: Estimated (earned) hours ÷ actual hours × 100. Above 100% means you’re beating the estimate.
This is the KPI that connects the shop to the estimating team. In the Dodge Construction Network Optimizing Digital Fabrication for Mechanical Contractors SmartMarket Brief, Ivey Mechanical described loading labor into every model element so the team can “compare back to the estimate and track against our actual performance.” Their example: discovering mid-job that they had installed 50% more fittings than estimated. “The sooner we can find out, the better off we are.”
3. Schedule adherence (on-time delivery to the field)
What it measures: The share of packages that ship complete by the date the field needs them. How to calculate: Packages delivered complete and on time ÷ packages due × 100.
This is the KPI your GC and field foremen actually feel. It’s the shop version of Percent Plan Complete (PPC), the Last Planner® System metric that tracks how many planned tasks were finished as promised. Track the reason for every miss too: late drawings, material shortages, rework or capacity. The reasons tell you where to fix the process.
4. First-pass quality yield
What it measures: The share of work that passes QA/QC the first time. How to calculate: Spools (or welds) accepted on first inspection ÷ total inspected × 100.
For code work, track weld reject rate alongside it. AZCO, a Burns & McDonnell company, saw its strongest early return from digital QA/QC. Weld logs and inspection steps were tracked digitally, which reduced errors and eliminated side spreadsheets. Every point of first-pass yield you gain is labor you don’t spend twice.
5. Rework hours
What it measures: Labor spent fixing, re-cutting or rebuilding work. How to calculate: Rework hours ÷ total direct labor hours × 100. Tag each rework entry with a cause (design change, drawing error, fit-up, material).
Rework is expensive everywhere in construction. The Construction Industry Institute has estimated rework at 2% to 20% of total contract value. And the FMI and Autodesk Construction Disconnected study tied 48% of all U.S. construction rework to poor data and miscommunication. In a fab shop, that usually means a fabricator built from an outdated revision.
6. Cycle time and work in progress (WIP)
What it measures: How long a spool or assembly takes to move from release to ship, and how much work is sitting partially done. How to calculate: Ship date minus release date, averaged by package. Track WIP as the count (or hours) of items started but not finished.
Long cycle times with high WIP almost always point to a bottleneck station: welding, QA or a single saw. Status by station is where real time fabrication tracking pays off. You see the pile-up when it starts, not after the truck leaves short.
7. Capacity utilization and backlog
What it measures: How much of your available shop labor is committed, and how many weeks of released work are in the queue. How to calculate: Scheduled hours ÷ available hours × 100. Backlog = released, unfinished hours ÷ weekly available hours.
This is the forward-looking KPI. It tells you when to add a shift, push back on a pull-in date or take on more work. It’s also where most contractors want to get better. Dodge found that forecasting work scheduling and tracking the fabrication process are the top improvement needs for large mechanical contractors.
How do fabrication shop managers measure throughput, labor efficiency and schedule adherence?
The math above is simple. Getting clean data is the hard part. Here’s a practical process:
- Pick one unit per trade. FDI, pounds, assemblies. Don’t change it mid-year.
- Capture status at the station, not at the end of the week. Fabricators log start and complete on a tablet or kiosk, so hours land on the right spool.
- Load estimated hours up front. Pull labor units from the model or estimate so every package has a target before it hits the floor.
- Review weekly as a team. Shop manager, VDC lead and PMs look at the same dashboard. Discuss the misses, not the averages.
- Feed results back to estimating. Actual hours by item type become better labor units on the next bid.
Paper travelers and spreadsheets make steps 2 through 5 painful, which is why many shops never get past step 1. Fab shop management software captures this data as work happens. According to Dodge, 54% of mechanical contractors already use fabrication management software, and 57% of large firms share fabrication data internally for scheduling, time tracking and material management.
ROI callouts: why these KPIs pay for themselves
| Metric | Source |
| ~1%/yr construction labor productivity growth vs. 3.6% in manufacturing | McKinsey Global Institute |
| 2%–20% of contract value lost to rework | Construction Industry Institute (via ENR) |
| 48% of U.S. rework caused by poor data and miscommunication | FMI / Autodesk Construction Disconnected |
| 35% of construction professionals’ time spent on non-productive activities like searching for information | FMI / Autodesk Construction Disconnected |
| Forecasting and process tracking are the top improvement needs for large mechanical contractors | Dodge SmartMarket Brief (2025) |
| 50% more fittings than estimated, caught mid-job by tracking actuals | Ivey Mechanical, Dodge SmartMarket Brief |
The bottom line
You don’t need 40 metrics. You need seven numbers that everyone trusts and reviews every week. Start with throughput, labor efficiency and on-time delivery. Add quality, rework, cycle time and capacity once the data is flowing. The shops that measure consistently are the ones that find bottlenecks early, bid tighter and keep their promises to the field.
FAQ – What People Are Asking
What are the most important KPIs for an MEP fabrication shop? The seven core KPIs are throughput, labor efficiency (actual vs. estimated hours), on-time delivery to the field, first-pass quality yield, rework hours, cycle time/WIP and capacity utilization. Together they show output, cost, quality and schedule performance.
How do you measure throughput in a pipe fabrication shop? Most pipe shops measure throughput in factored diameter inches (FDI) or welds completed per day or week. Use the same unit every period so trends are comparable.
How do you calculate labor efficiency in a fab shop? Divide estimated (earned) hours for completed work by actual hours spent, then multiply by 100. A result over 100% means the shop is beating the estimate.
What is a good on-time delivery rate for prefabrication? There’s no published industry benchmark for MEP fab shops. Set a baseline from your own data, then track the reason for every late package. Lean builders using Percent Plan Complete typically aim to raise it steadily over time rather than hit a fixed number.
How does fab shop management software help track KPIs? It captures status, labor hours and QA/QC data at each station as work happens. That replaces end-of-week paper tallies with real-time dashboards by spool, package and project, and feeds actual hours back into future estimates.
DEWALT Construction Technology gives MEP fab shops real-time dashboards for throughput, labor, quality and schedule, by spool, package and project. See your shop’s KPIs in one place: book a demo →
Related reading on msuite.com:
- Key Metrics Every Fabrication Shop Needs to Track
- Boost Shop Productivity with MSUITE’s Analytics Dashboard
- 5 Metrics Every Fab Shop Needs to Track on Data Center Projects
- How to Improve Quality Tracking in Your Fabrication Shop
Sources:
- Dodge Construction Network, Optimizing Digital Fabrication for Mechanical Contractors SmartMarket Brief (survey of 197 U.S. mechanical contractors, August 2025), download via MSUITE
- McKinsey Global Institute, Reinventing Construction: A Route to Higher Productivity (2017)
- FMI and Autodesk, Construction Disconnected (2018)
- ENR, “Contractors Confront the Growing Costs of Rework”, citing Construction Industry Institute research
- Glenn Ballard and Iris Tommelein, UC Berkeley Project Production Systems Laboratory, Current Process Benchmark for the Last Planner® System (2021)
- MCAA Smart Solutions, Winter 2026: “Boosting Productivity & Quality” (Waldinger Corporation)
- DEWALT/MSUITE, How AZCO Brought Real-Time Control to Pipe Fabrication case study (2026)