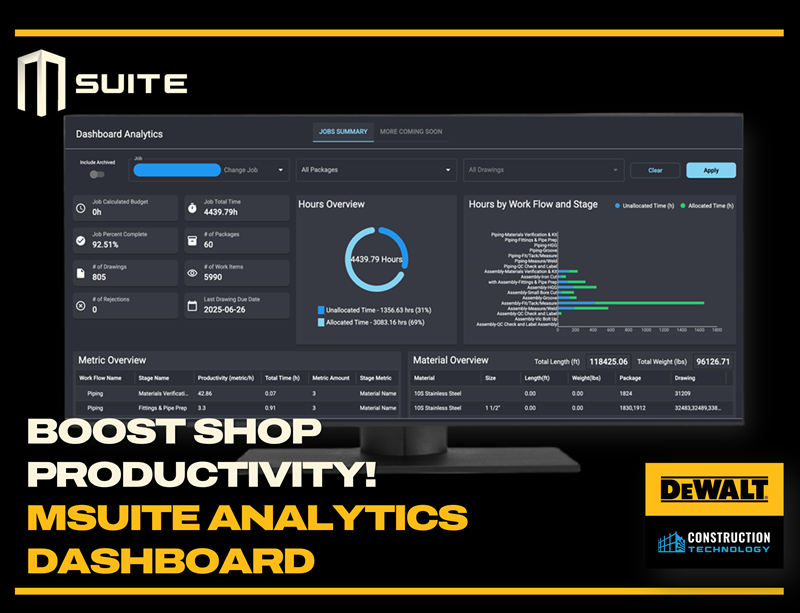
Your fabrication shop can’t afford guesswork. Every hour, spool, and workflow must perform at peak levels to keep projects on schedule and profits growing.
MSUITE’s new Analytics Dashboard gives managers full control. It provides useful insights and KPI metrics. This helps increase productivity, reduce waste, and speed up delivery.
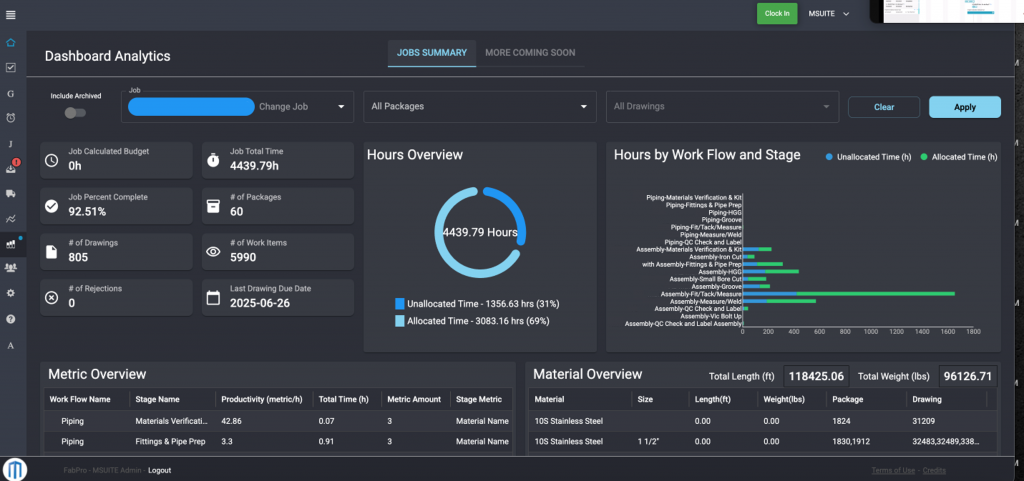
The dashboard has strong features and easy-to-understand visuals. It gives a up-to-date view of shop performance across workflows, stages, and teams. It empowers leaders to make smarter decisions, identify bottlenecks, and keep production moving efficiently.
Why Fabrication Shops Need Real-Time Analytics
Today’s fabrication shops are under intense pressure to produce faster and smarter while maintaining quality and controlling costs. Complex projects and rising labor expenses make real-time visibility a necessity.
Without centralized metrics, managers often react to problems instead of preventing them. Downtime, material waste, and uneven workloads can quickly erode profits. MSUITE’s Analytics Dashboard delivers:
-
- Up-to-date visibility into shop performance
- Actionable insights to streamline workflows
- Critical KPIs for labor, materials, and productivity
- High-level company and job reports to support operational insights
By turning raw data into clear, actionable insights, shop managers can elevate performance across every project.
Key Features of MSUITE’s Analytics Dashboard
MSUITE built the Analytics Dashboard to give fabrication shop managers the critical information they need at a glance. Here’s how each feature drives results.
1. Job Summary: Quick Production Health Check
Get a high-level view of job size, completion percentage, and current status. Job Summary helps managers:
- Track progress across multiple projects
- Spot underperformance before it causes delays
- Allocate resources to keep top-priority jobs moving
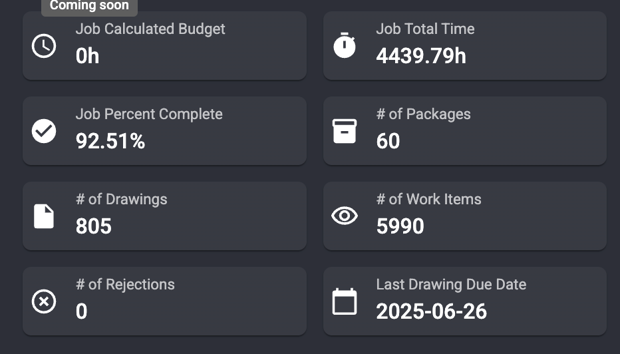
With centralized job data, managers spend less time chasing updates and more time optimizing output.
Job Summary is a quick snapshot of size and completion information of a job. The hours overview displays how the shop uses time.
A significant benefit is a look into how users are using their timers – identify gaps in proper usage. Our customers report a goal of 75% allocated time across projects.
2. Hours Overview: Maximize Labor Utilization
Visualize how time is allocated across the shop and uncover inefficiencies. Benefits include:
- Monitoring time by workflow to ensure labor focus
- Pinpointing idle or misallocated resources
- Targeting 75%+ allocated time for maximum shop efficiency
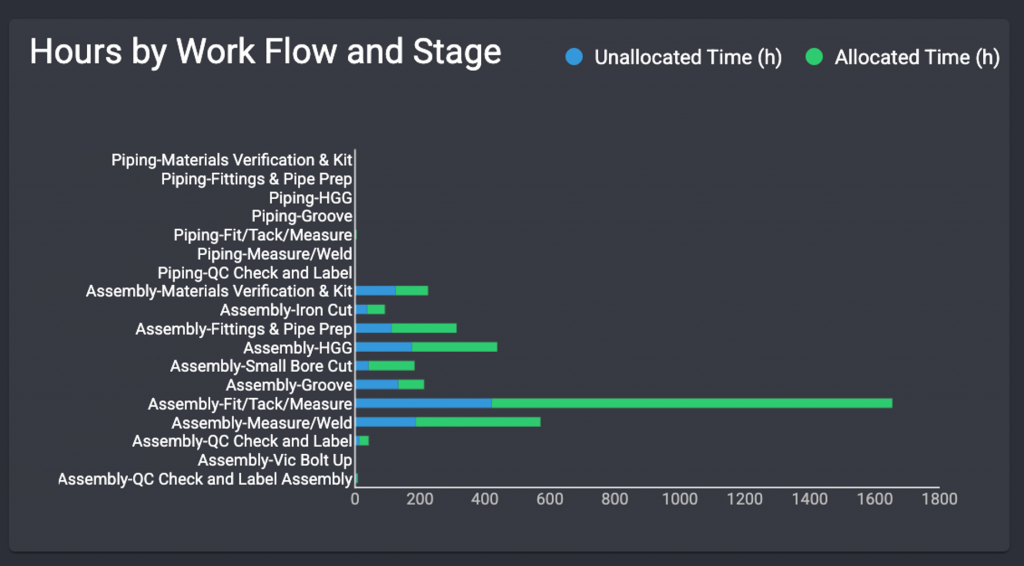
Hours by workflow and stage will show where teams spend their time and indicate if they are efficient.

Rollup Charts provide a simple way to analyze and make critical decisions for the team giving you clean dashboards to bring to project meetings.
3. Hours by Workflow and Stage: Zeroing in on Bottlenecks
The dashboard drills deeper with Hours by Workflow and Stage, showing where time is being spent at each stage of the production process.
This level of granularity allows managers to:
- Pinpoint stages where timers aren’t being used correctly.
- Spot workflow delays before they snowball into missed deadlines.
- Reallocate labor or materials to keep production flowing smoothly.
By surfacing inefficiencies early, fabrication shops can maintain continuous production and reduce costly stoppages.
4. Metric Overview: Measure Productivity Per Stage
Track key performance metrics like average size per manhour at each stage. Metric Overview enables managers to:
- Benchmark team productivity for overall job
- Compare job performance to identify best practices
- Set realistic goals to drive continuous improvement
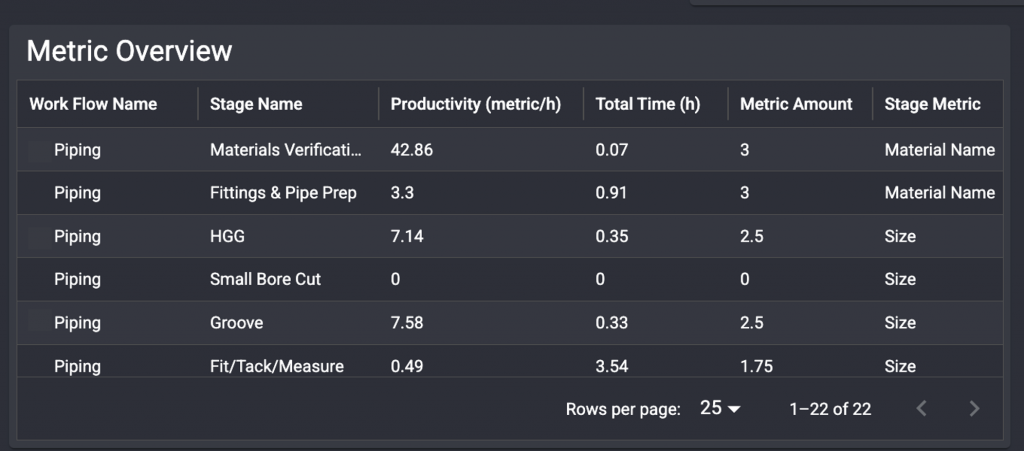
This feature fosters a culture of accountability and performance across the shop floor.
5. Material Overview: Smarter Material Management
Materials account for a large share of fabrication costs. Material Overview provides totals by job, package, or spool, helping managers:
- Avoid shortages that halt production
- Reduce waste with improved consumption tracking
- Forecast material needs more accurately
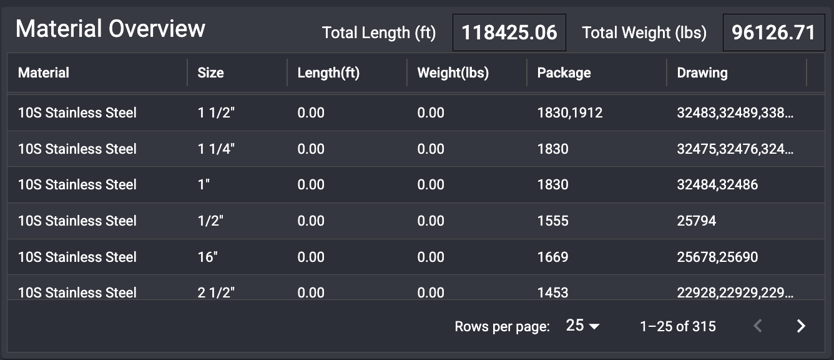
Better material insights lead to leaner operations and fewer costly surprises.
Driving ROI Through Data
The Analytics Dashboard isn’t just a reporting tool—it’s a catalyst for higher productivity. With real-time insights, managers can:
- Reduce labor and material waste through smarter allocation
- Improve on-time delivery with early issue detection
- Make faster, more informed decisions around MSUITE usage to maximize your ROI (Verify your software and hardware investments are worth the cost)
Shops that embrace data-driven operations deliver more value to clients and strengthen their bottom line.
Built for Modern Fabrication Leaders
Top shop managers helped create MSUITE’s Analytics Dashboard and a crucial feature of the innovative MSUITE Fab platform. They designed it to connect fabrication and installation. This is perfect for small shops and large facilities.
Ready to Take Control of Your Shop’s Performance?
The future of fabrication is data-driven. MSUITE’s Analytics Dashboard gives you useful insights. This helps you lead better, increase production, and grow your business.
Take control of your shop’s future. Schedule your MSUITE demo today to see the Analytics Dashboard in action.