Running a successful fabrication shop requires more than skilled labor and quality equipment. Today’s competitive environment demands data-driven decision-making to keep projects profitable and on schedule.
Without visibility into performance, it’s easy for small inefficiencies, such as material waste or delayed spools, to add up and erode margins.
Tracking the right fabrication shop metrics is the foundation for continuous improvement. With the right insights, shop leaders can identify bottlenecks, rebalance workloads, and forecast more accurately.
Here are the key metrics every fabrication shop should track, and how modern dashboards make it easier to turn raw numbers into more data-driven business decisions.
1. Throughput Rate
Throughput measures how much work your shop produces within a given timeframe. Whether that’s the number of spools, assemblies, or linear feet of pipe, throughput shows if production is meeting schedule requirements.
Low throughput often signals bottlenecks in design, spooling, or machine utilization. By monitoring this metric daily, managers can adjust resources before delays impact deliverability.
2. Labor Productivity
Labor is one of the most significant costs in a fabrication shop. Tracking labor hours against completed output reveals whether your workforce is operating at peak efficiency.
For example, comparing planned vs. actual labor hours helps identify underperforming tasks and training opportunities. Shops that consistently track labor productivity are better positioned to control costs and bid more competitively.
3. Machine Utilization
CNC cutters, benders, and welders are capital-intensive investments. Yet many shops don’t have visibility into how often machines sit idle versus operating at full capacity.
Monitoring machine utilization helps ensure you’re getting maximum ROI on equipment and highlights when preventive maintenance or scheduling adjustments are needed.
4. Material Waste Percentage
Material waste directly impacts profit margins. Even small inefficiencies, like incorrect cuts, damaged stock, or over-ordering—add up quickly.
By tracking material waste percentage (wasted materials divided total materials used), shops can pinpoint problem areas and improve accuracy in ordering and cutting. This also helps meet sustainability goals by reducing unnecessary scrap.
5. Rework and Error Rates
Rework is one of the most expensive drains on productivity. Whether caused by design errors, miscommunication, or shop mistakes, every hour spent fixing problems is an hour lost to new production.
Tracking error rates per project gives managers a clearer picture of where mistakes occur. Over time, this data helps strengthen quality control processes and reduce costly rework.
6. On-Time Delivery
Fabrication shops don’t work in isolation; every assembly must align with field schedules. Monitoring the on-time delivery rate ensures your shop is meeting deadlines and supporting project success.
Late deliveries create ripple effects across the entire construction schedule. By identifying delivery delays early, shops can adjust workflows or communicate with project teams before minor issues escalate.
7. Work-in-Progress (WIP)
Knowing how much work is currently in production helps managers balance workloads and prevent bottlenecks. Tracking WIP by stage—design, spool creation, cutting, welding, assembly—gives real-time visibility into where jobs are slowing down.
A well-managed WIP pipeline reduces downtime and helps forecast labor and material needs more accurately.
8. Shop Capacity vs. Demand
Every shop has a maximum output capacity, but demand often fluctuates across projects. Tracking capacity utilization ensures your resources are neither overextended nor underutilized.
By aligning shop capacity with project demand, managers can prevent burnout, avoid overtime costs, and maintain a steady, predictable workflow.
9. Safety Incidents
While often overlooked in productivity discussions, safety metrics are essential. Tracking near misses, lost-time incidents, and safety compliance rates protects workers and reduces the financial risk of accidents.
A safer shop is a more productive shop. Consistent monitoring of safety data reinforces training and builds a culture of accountability.
10. Financial Metrics: Cost per Spool or Assembly
Ultimately, fabrication shops need visibility into cost efficiency. Tracking cost per spool, joint, or assembly provides a bottom-line view of profitability.
When combined with labor, material, and machine data, this metric helps leaders forecast project costs more accurately and uncover opportunities to improve margins.
Why Dashboards Make Metrics Actionable
Collecting data is only half the battle—turning it into actionable insights is where real value lies. Many shops still rely on spreadsheets or siloed systems, making it difficult to see the big picture.
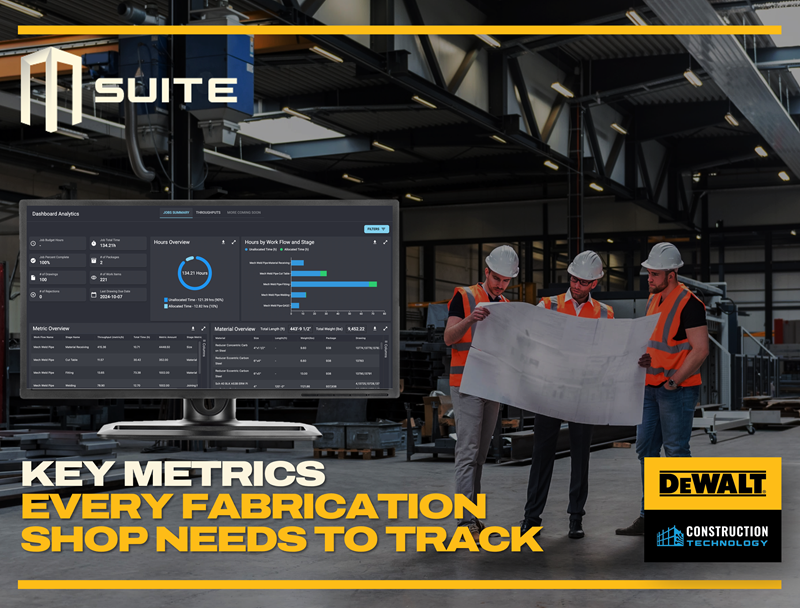
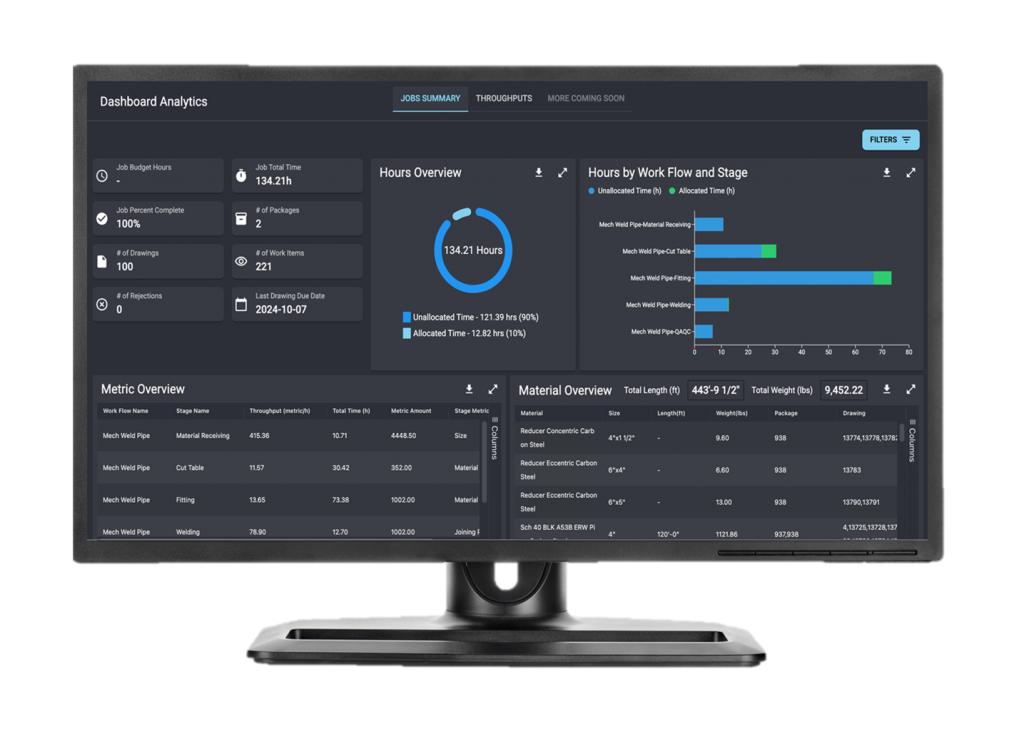
That’s where a tool like MSUITE’s Analytics Dashboard adds value. It provides:
- Real-time KPIs for throughput, labor, materials, and productivity.
- Visual dashboards that make trends easy to spot.
- Cross-project insights to benchmark performance across multiple jobs.
- Predictive analytics to help managers address bottlenecks before they escalate.
With centralized dashboards, shop leaders move from reactive firefighting to proactive decision-making.
Learn more about MSUITE’s Analytics Dashboard.
The most successful fabrication shops aren’t just producing, they’re measuring, analyzing, and improving.
By tracking key metrics like throughput, labor productivity, machine utilization, and on-time delivery, shops gain the visibility needed to stay competitive.
Dashboards make these metrics actionable by providing real-time insights, reducing waste, and enabling more intelligent resource allocation. For contractors looking to accelerate productivity and profitability, focusing on the right metrics is the first step.
Frequently Asked Questions (FAQs)
What are the most critical fabrication shop metrics?
Throughput, labor productivity, machine utilization, and material waste are among the most critical metrics. Together, they provide a clear picture of shop efficiency and profitability.
How do dashboards help fabrication shops?
Dashboards turn raw data into visual insights. Instead of waiting for end-of-month reports, shop managers can see live KPIs, spot bottlenecks, and make faster decisions to keep projects on track.
How can shops reduce material waste?
Shops can reduce waste by tracking material usage closely, using fabrication-ready machine outputs, and implementing real-time monitoring tools that prevent errors before they happen.
Why is tracking rework important?
Rework adds hidden costs and delays. By tracking error and rework rates, shops can identify root causes such as misaligned drawings or shop errors and prevent them on future projects.
Can small fabrication shops benefit from analytics tools?
Yes. Even small shops gain value from tracking metrics. With cloud-based dashboards, teams can access real-time insights without expensive IT infrastructure, helping them stay competitive against larger firms.